leaderbot.evaluate.compare_ranks#
- leaderbot.evaluate.compare_ranks(models, order=None, rank_range=None, ax=None, bg_color='none', fg_color='black', mf_color='white', save=False, latex=False)#
Compare ranking of various models.
- Parameters:
- modelslist
A list of models, with at least two models.
- orderlist or np.array_like, default=None
A list of indices to re-order or select from the list of models. If None, the models appear are given in the
modelslist.- rank_rangelist, default=None
A range of ranks
[rank_min, rank_max]to be used in the comparison. The rank indices inrank_rangeare 1-based indexing and inclusive on both start and end of the range. The ranking range is with respect to the rank that is provided by the first model in themodelslist. If None, the full range of ranks is used.- axmatplotlib.axes._axes.Axes
If a matplotlib axis object is given, this plot is shown in the provided axis. Otherwise, a new plot is generated.
- bg_colorstr or tuple, default=’none’
Color of the background canvas. The default value of
'none'means transparent.- fg_colorstr or tuple, default=’black’
Color of the axes and text.
- mf_colorstr or tuple, default=None
Marker face color. If None, the ``bg_color` is used
- savebool, default=False
If True, the plot will be saved. This argument is effective only if
plotis True.- latexbool, default=False
If True, the plot is rendered with LaTeX engine, assuming the
latexexecutable is available on thePATH. Enabling this option will slow the plot generation.
- Raises:
- RuntimeError
If any of the models are not trained before calling this method.
See also
Examples
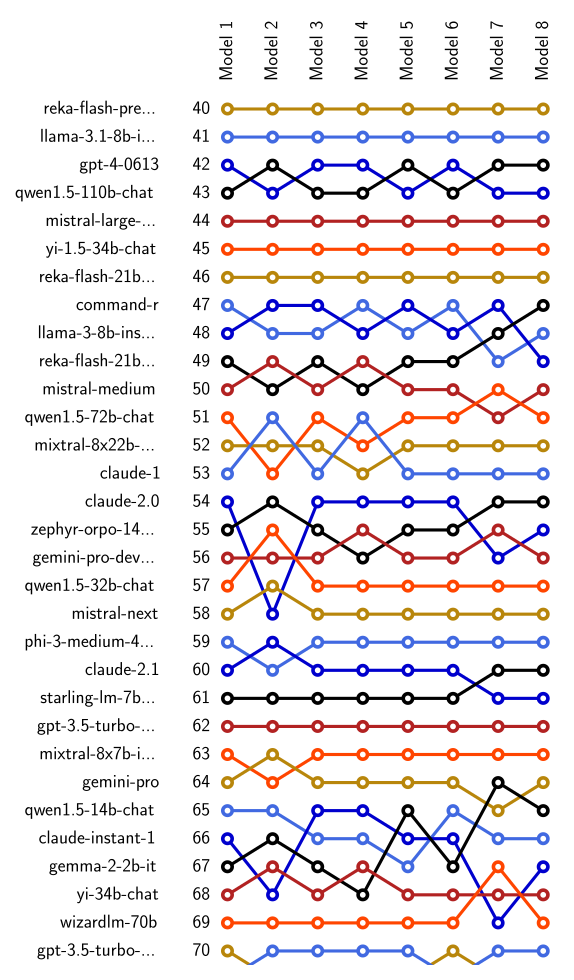
>>> import leaderbot as lb
>>> from leaderbot.models import BradleyTerry as BT
>>> from leaderbot.models import RaoKupper as RK
>>> from leaderbot.models import Davidson as DV

>>> # Load data
>>> data = lb.data.load()

>>> # Create a list of models to compare
>>> models = [
...     BT(data, k_cov=0),
...     BT(data, k_cov=3),
...     RK(data, k_cov=0, k_tie=0),
...     RK(data, k_cov=0, k_tie=1),
...     RK(data, k_cov=0, k_tie=3),
...     DV(data, k_cov=0, k_tie=0),
...     DV(data, k_cov=0, k_tie=1),
...     DV(data, k_cov=0, k_tie=3)
... ]

>>> # Train the models
>>> for model in models: model.train()

>>> # Compare ranking of the models
>>> lb.evaluate.compare_ranks(models, rank_range=[40, 70])
The above code produces plot below.