leaderbot.models.RaoKupper.cluster#
- RaoKupper.cluster(ax=None, max_rank=None, tier_label=False, method='complete', color_threshold=0.15, bg_color='none', fg_color='black', save=False, latex=False)#
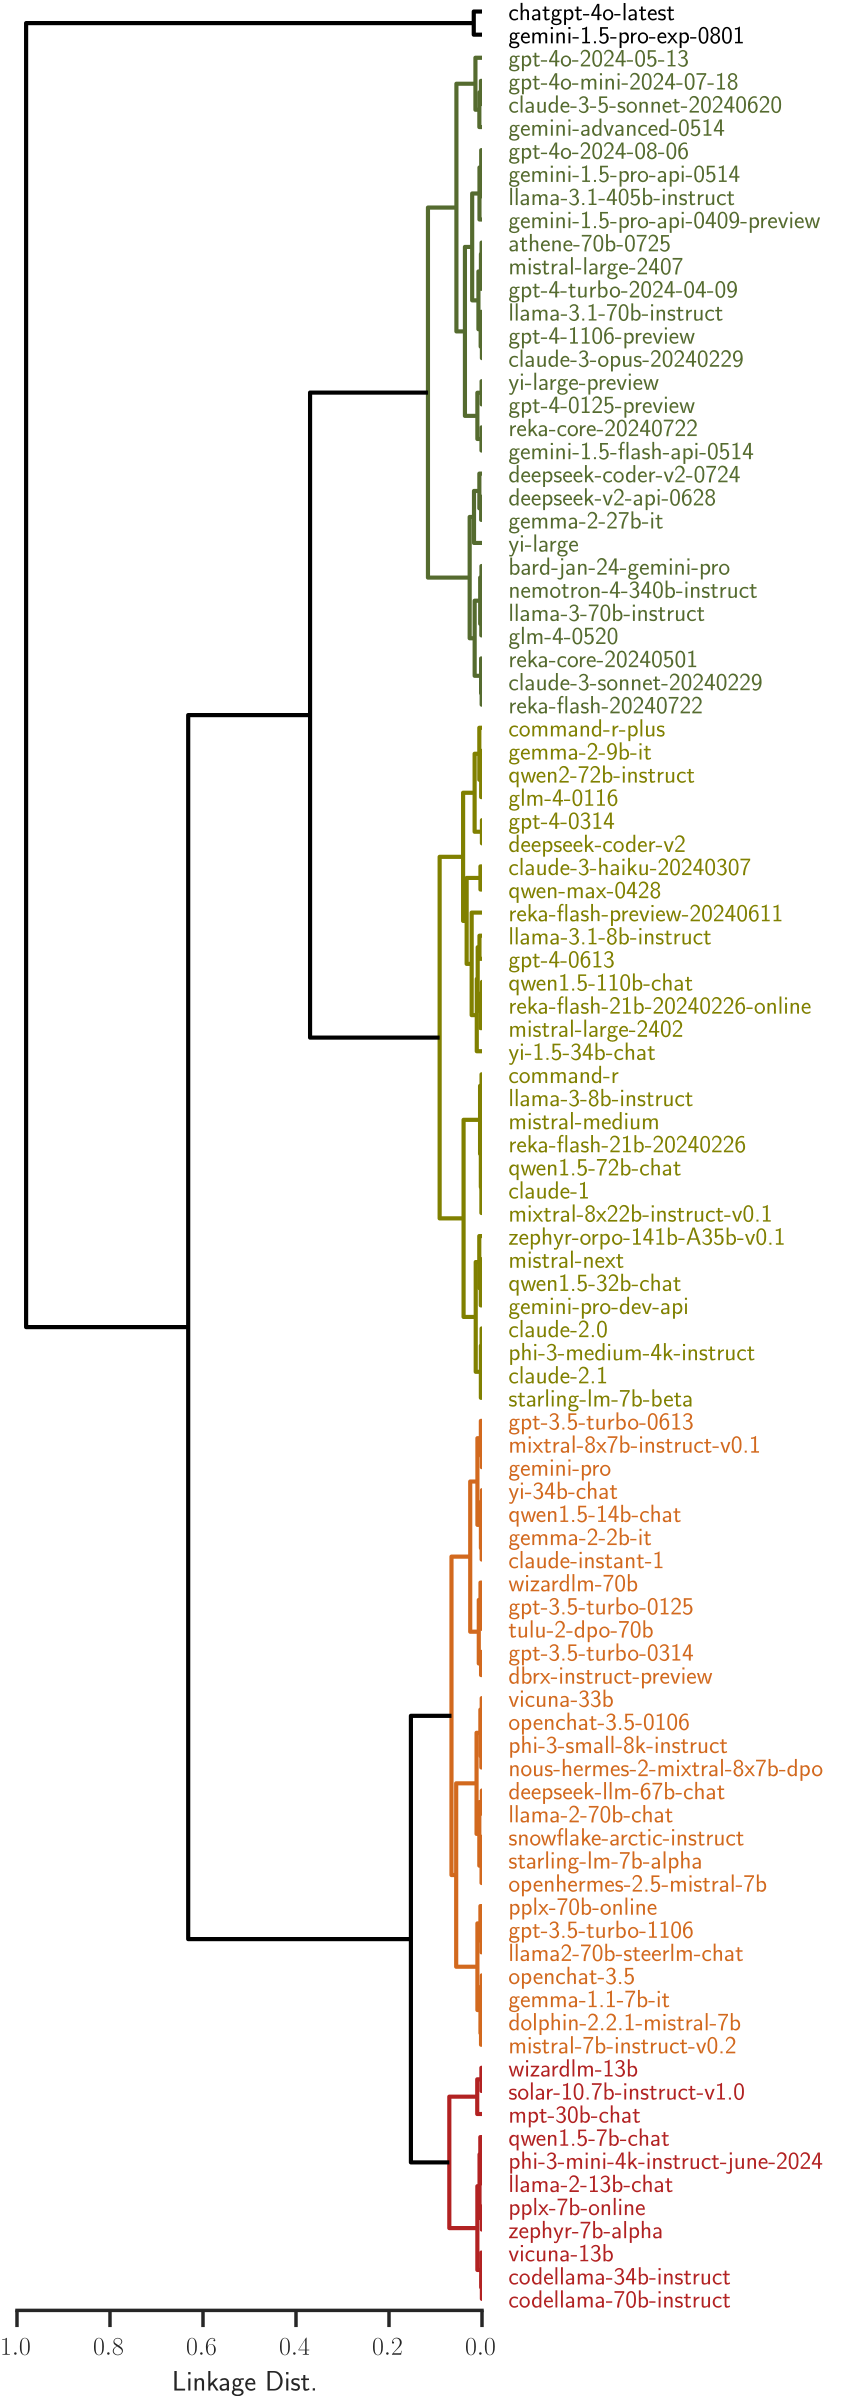
Cluster competitors to performance tiers.
- Parameters:
- axmpl_toolkits.mplot3d.axes3d.Axes3D, default=None
Axis object for plotting. If None, a 3D axis is created.
- max_rankint, default=None
The maximum number of agents to be displayed. If None, all agents in the input dataset will be ranked and shown.
- tier_labelbool, default=False,
If True, the branch lines up to the first three hierarchies are labeled.
- methodstr, default=’complete’
Clustering algorithm. See scipy.cluster.hierarchy.linkage methods.
- color_thresholdfloat, default=0.15
A threshold between 0 and 1 where linkage distance above the threshold is rendered in black and below the threshold is rendered in colors.
- bg_colorstr or tuple, default=’none’
Color of the background canvas. The default value of
'none'means transparent.- fg_colorstr or tuple, default=’black’
Color of the axes and text.
- savebool, default=False
If True, the plot will be saved. This argument is effective only if
plotis True.- latexbool, default=False
If True, the plot is rendered with LaTeX engine, assuming the
latexexecutable is available on thePATH. Enabling this option will slow the plot generation.
- Raises:
- RuntimeError
If the model is not trained before calling this method.
See also
Examples
>>> from leaderbot.data import load
>>> from leaderbot.models import RaoKupperFactor

>>> # Create a model
>>> data = load()
>>> model = RaoKupperFactor(data, n_cov_factor=3, n_tie_factor=20)

>>> # Train the model
>>> model.train()

>>> # Plot kernel PCA
>>> model.cluster(max_rank=100, tier_label=True, latex=True)
The above code produces plot below.