leaderbot.models.RaoKupper.match_matrix#
- RaoKupper.match_matrix(max_rank=None, density=True, source='both', win_range=None, tie_range=None, horizontal=False, bg_color='none', fg_color='black', save=False, latex=False)#
Plot match matrices of win and tie counts of mutual matches.
- Parameters:
- max_rankint, default=None
The maximum number of agents to be displayed. If None, all agents in the input dataset will be ranked and shown.
- densitybool, default=True
If False, the frequency (count) of win and tie are plotted. If True, the probability of the win and tie are plotted.
- source{
'observed','predicted','both'}, default='both' The source of data to be used:
'observed': The observed win and tie counts based on the input training data to the model.'predicted': The prediction of win and tie counts by the trained model.'both': Plots both of the observed and predicted data.
- win_rangetuple, default=None
The tuple of two float numbers
(vmin, vmax)determining the range of the heatmap plot for win matrix. If None, the minimum and maximum range of data is used.- tie_rangetuple, default=None
The tuple of two float numbers
(vmin, vmax)determining the range of the heatmap plot for tie matrix. If None, the minimum and maximum range of data is used.- horizontalbool, default=False
If True, the subplots for win and tie are placed row-wise. If False, they are plotted in column-wise.
- bg_colorstr or tuple, default=’none’
Color of the background canvas. The default value of
'none'means transparent.- fg_colorstr or tuple, default=’black’
Color of the axes and text.
- savebool, default=False
If True, the plot will be saved. This argument is effective only if
plotis True.- latexbool, default=False
If True, the plot is rendered with LaTeX engine, assuming the
latexexecutable is available on thePATH. Enabling this option will slow the plot generation.
- Raises:
- RuntimeError
If the model is not trained before calling this method.
See also
Examples
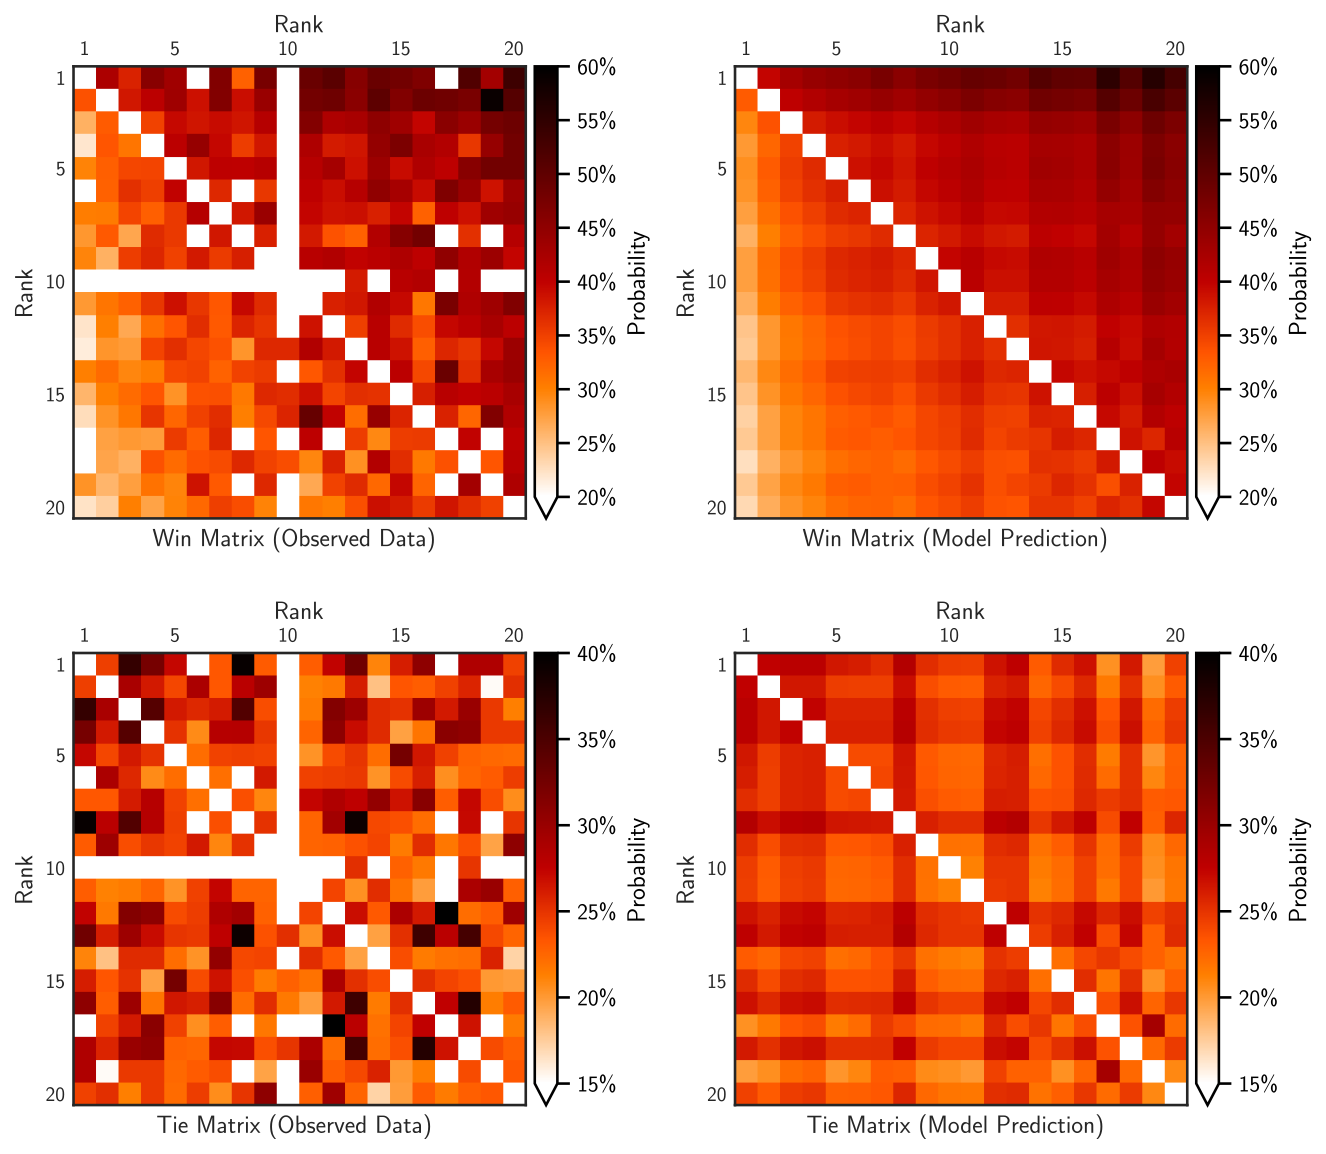
>>> from leaderbot.data import load
>>> from leaderbot.models import Davidson

>>> # Create a model
>>> data = load()
>>> model = Davidson(data)

>>> # Train the model
>>> model.train()

>>> # Plot match matrices for win and tie
>>> model.match_matrix(max_rank=20, density=True, source='both',
...                    latex=True, save=True, horizontal=True,
...                    win_range=[0.2, 0.6], tie_range=[0.15, 0.4])
The above code provides the text output and plot below.
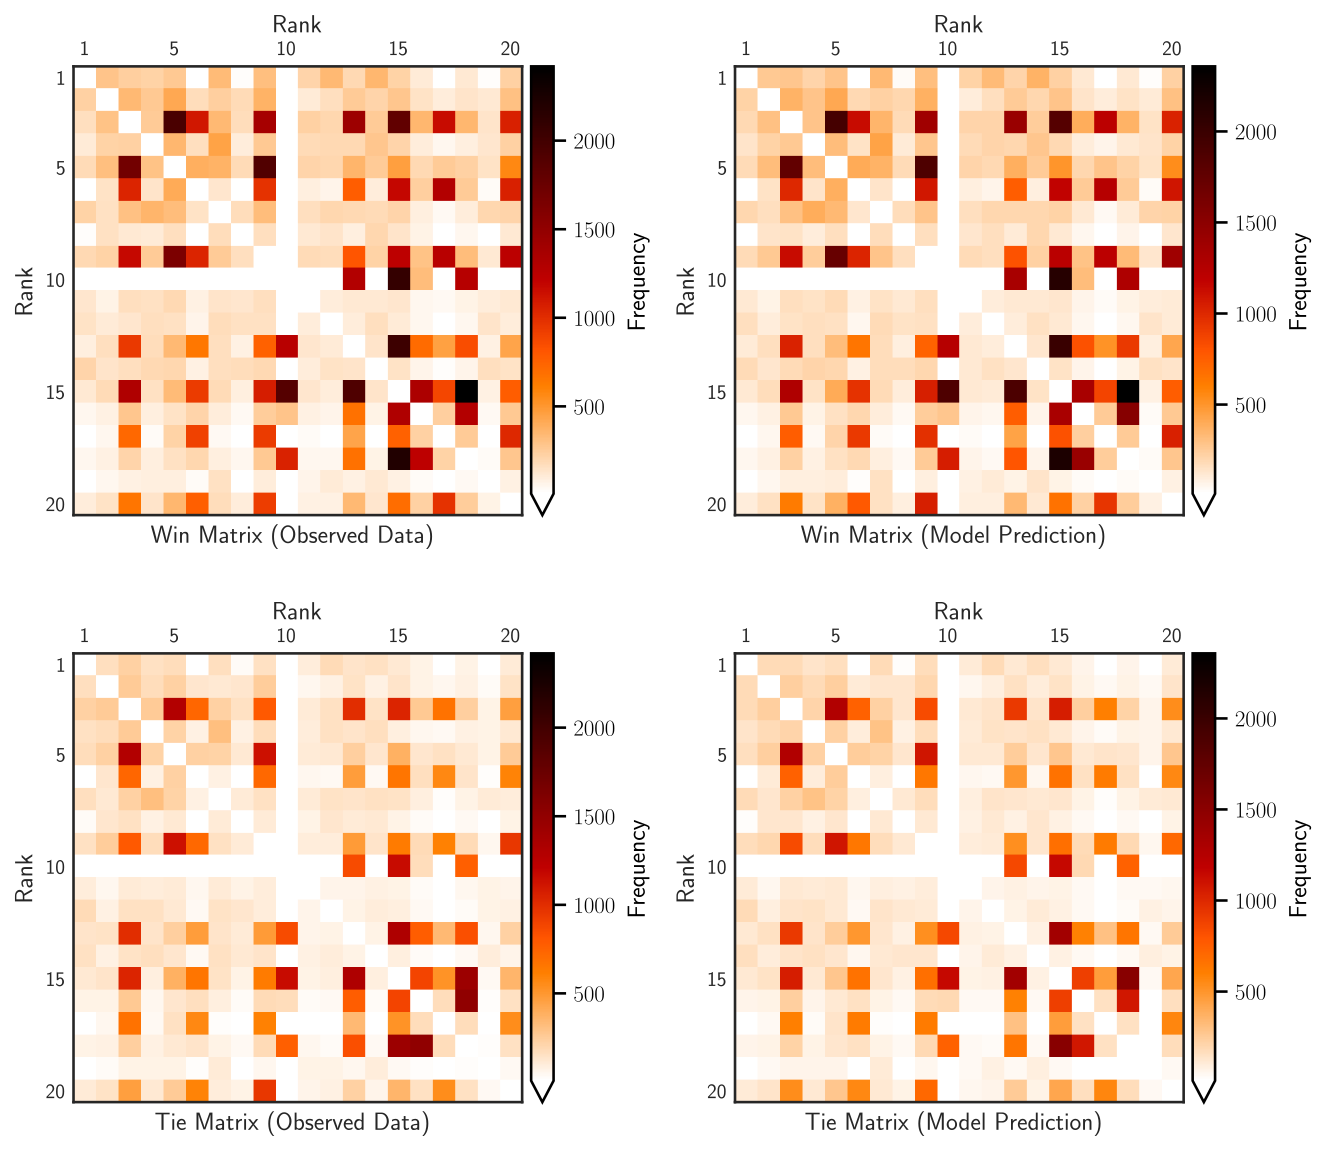
Similarly, plots for win and tie frequencies can be obtained as follows:
>>> # Plot match matrices for win and tie
>>> model.match_matrix(max_rank=20, density=False, source='both',
...                    latex=True, save=True, horizontal=True,
...                    win_range=[0, 3000], tie_range=[0, 1500])